

Bang for the buck: Google ads in the Indian Parliamentary Election
Executive Question: Who is the winner?

Now the elections are over at the federal level in India.
The results are in. Out of 543 total seats, the top parties are
Bharatiya Janata Party 240
Indian National Congress 99
Samajwadi Party 37
Trinamool Congress 29
Dravida Munnetra Kazhagam 22
Telugu Desam Party 16
How have the parties spent on Google advertisements?
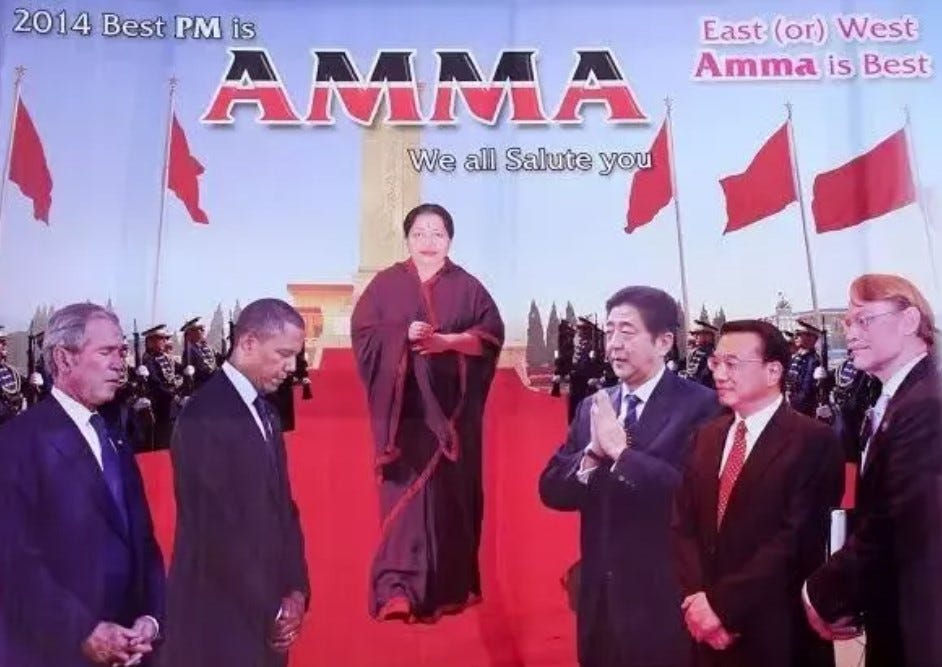
General ads can be quite cringeworthy. [Ad in 2014 for J. Jayalalitha (aka Amma), chief minister of Tamil Nadu aspiring to be the Prime Minister. She died two years later.]
Executive question: Why Google ads?
Executive answer: There are 500 million users of YouTube in India (more than double than that of the US). We also know that in India YouTube serves as *the* most important source of political news. Google ads, on the other hand, can be targeted to specific region, demographics.
Ad spend ₹2,255,234,000 (INR)
Total ads 207,144
Per ad, around ₹11,000.
Spending over time: Weekly
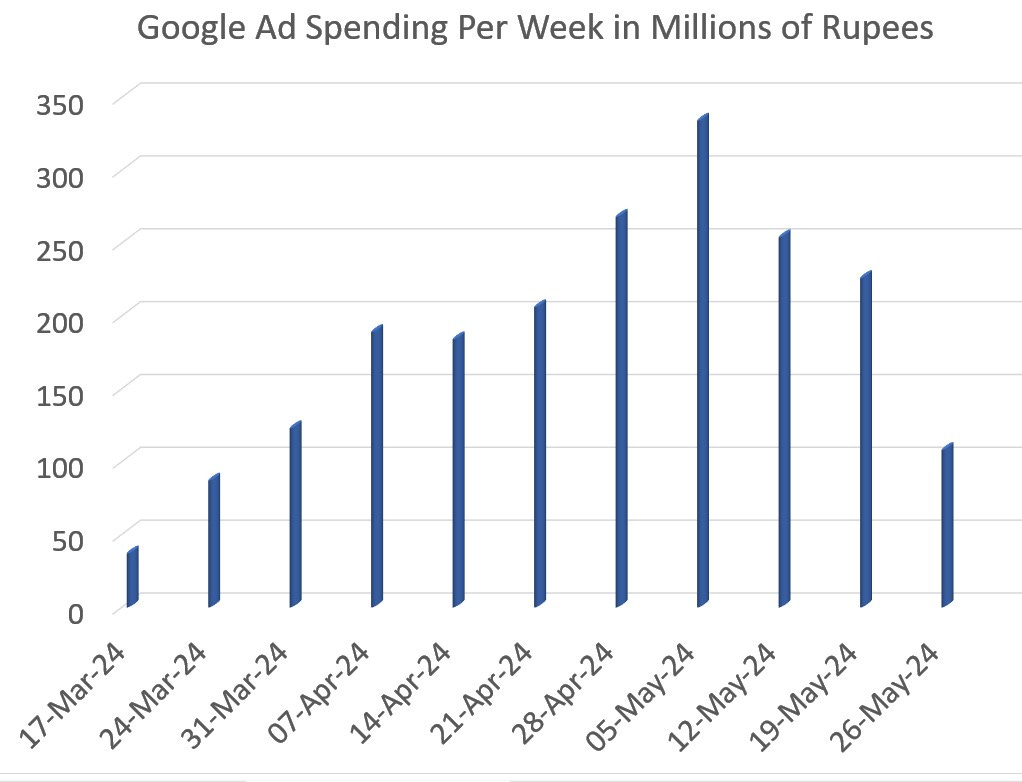
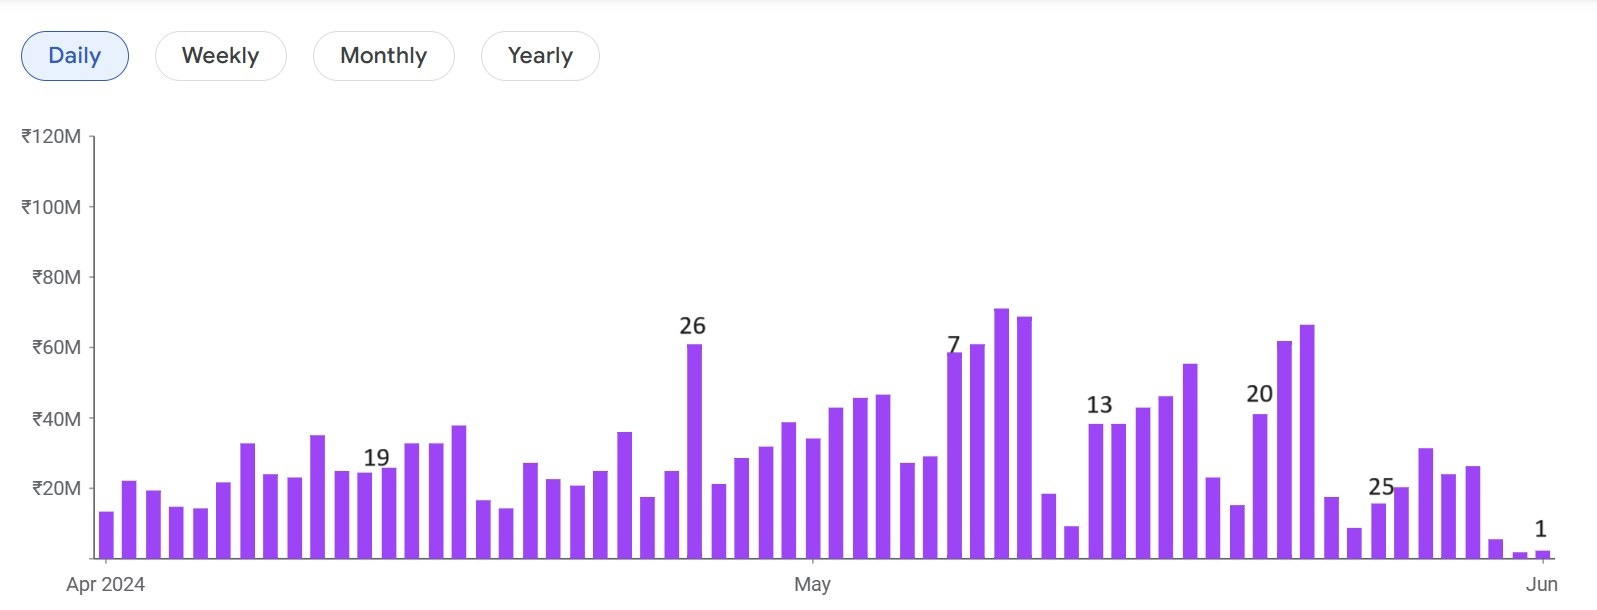
Parties spent the highest around midway through the election cycle (of six weeks). But their expenditure did not quite match the actual election dates. To see that, we need to examine the daily expenditure over the cycle. In the graph below, I have indicated the dates of actual elections. The advertising peaks do not coincide with the election dates - except for the 26th of May.
Top Advertisers by name (March 1 – June 1, 2024) [Not all ads came with a party stamp.]
Bharatiya Janata Party ₹862M
Indian National Congress ₹454M
Biju Janata Dal ₹208M
Yuvajana Sramika Rythu Congress Party ₹128M
Telugu Desam Party ₹62M
Executive summary: Of the top five advertisers, three are regional parties and two national ones.
There is one prominent (regional) party missing in the list: Trinamool Congress (of West Bengal). The party spends money through hired consultants. Here is an example.

It is a three line rhyming poem of sorts exhorting the faithful to reject the BJP for being against Bengal.
There are other cases where some specific company spent money on specific parties but in specific geographical locations. Here is an example.

This is an advertisement for a particular candidate of the Congress Party in a specific state. There are thousands of such examples out of the total number of ads of 207,000. Only the BJP has very very few of those.
Then, there are other ads classified as “political” ads when there is no politics in it at all. Here is an example. It is an ad for Gillette Guard razor with the standard tagline “Shave kar, be fikr” [Shave without apprehension]

It would be complicated to weed out all the superfluous ads from the 207,000 of them.
Executive question: Which national party got the biggest bang for the buck?
To answer that question, I calculate how much money the BJP/INC spent per MP elected.
Executive result: The BJP spent 3.6 million rupees per elected candidate, the Congress has spent 4.6 million per candidate. The BJP got better bang for the buck.
Note that on March 21, the same Congress party declared that their bank accounts were all frozen. Their candidates do not have any money to spend. Yet they managed to spend more than the BJP per candidate.
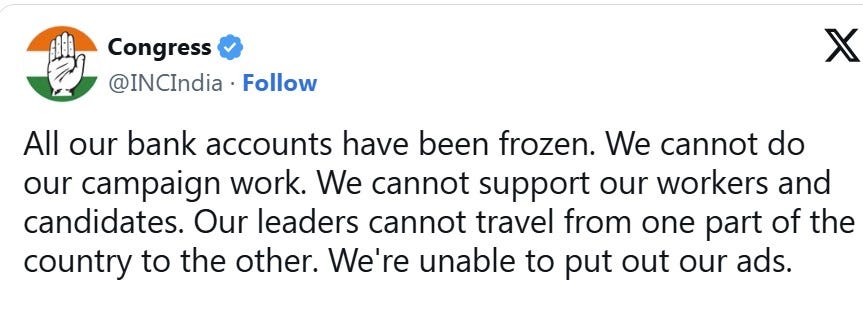
Executive problem of arithmetic: Something does not add up.
Regional spending
If we examine spending by state, this are big spenders (in absolute value *not* per candidate)
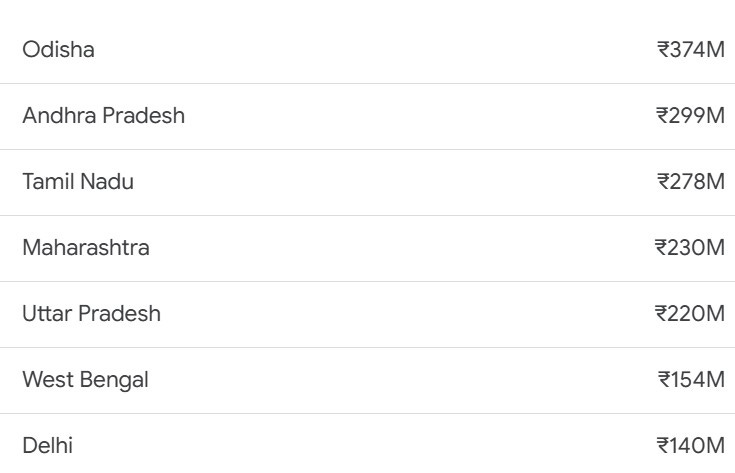
The first thing we notice is that the spending is *not* proportional to the number of parliamentary seats at all.
Executive question: What is going on?
The puzzle begins to make sense once we note that there were two statewide elections being held at the same time: Andhra Pradesh and Odisa. Not surprisingly, they are at the top of the list. Ad money was being spent for the state elections.
Here I encountered a problem: In Odisa, the BJD has spent a lot of money but won zero Lok Sabha seats. However, at the same time, they contested and *won* a number of Vidhan Sabha seats.
[At the suggestion of well-known psephologist R. Karandikar] I converted the Bidhan Sabha seats into Lok Sabha seats at the rate of 5 to 1 - roughly - the number of voters in a constituency breaks at that ratio.
With that conversion, we get the following numbers for the regional parties
Yuvajana Sramika Rythu Congress Party 32.0m
Trinamool 3.8m
Telugu Desam Party 1.8m
Biju Janata Dal 23.1m
Samajwadi Party - zero
Executive result: The regional party YSR Congress got the lowest result for their spending - per winning candidate, it managed to spend 32 million rupees. The BJD in Odisa comes next. It spent 23 million per winning candidate. One caveat here: This is after converting the state seats into equivalent national seats as they have won zero seats at the (national) parliament.
For the big regional Samajwadi Party (of Uttar Pradesh), we have the opposite problem of the BJD. It has won a number of seats but there is no trace of any spending in Google Ads. We do not know the reason. One possibility is that being a (mainly) rural party campaigning in low income areas, it did not find any appeal in Google ads. The other possibility is that it did spend the money through agencies that is hard to discern.
Executive conclusion: Political advertising on Google in India will become a valuable tool for the future about the role of money in elections in India (it is not there yet).